The Architecture of Modern Observability Platforms
An observability platform is an end-to-end system that helps organizations understand the health of their applications and services. This understanding comes from the three pillars of modern observability: metrics (time series data), logs (text-based data), and traces (request data with associated baggage/metadata).
The challenge of modern-day observability is scale - instead of a single host running a LAMP stack generating a few megabytes of observability data per day, we now have Kubernetes clusters with thousands of services generating gigabytes of observability data every hour.
The challenge of collecting, ingesting, storing, and querying observability data at scale is what modern observability platforms are designed to tackle. Depending on the underlying architecture, the cost of running these platforms can vary by a factor of over 100x. This post covers different types of architectures and solutions that implement them.
The Observability Pipeline
Before diving into architecture, an overview of concepts. There are four distinct phases when it comes to making use of observability data:
collection: observability data is received at the edge (usually in the form of an agent running on a host)
ingestion: observability data is processed at the destination (usually involves batching, compression, and additional transformations to get the data in the optimal shape for storage)
storage: observability data is retained (usually involves indexing)
query: observability data is looked up (usually involves translating a query to a GET/LIST request to the underlying storage system)
Observability Architectures
Distinct and Separate Components
As observability evolved from checking syslog to dedicated systems devoted to monitoring, early platforms build highly specialized services for each of the observability pillars. This meant that metrics, logs, and traces were processed by completely independent systems with distinct collection, storage, and query layers.
In the open-source world, this might take the form of running Prometheus, Elasticsearch, and Jaeger. The pipeline for each service is listed below.
Prometheus for metrics
collect (prometheus scraper) -> ingest(prometheus) -> store (prometheus) -> query (prometheus)
Elasticsearch for logs
collect (logstash) -> ingest (elasticsearch) -> store (elasticsearch) -> query (elasticsearch)
Jaeger for traces
collect (jaeger collector) -> ingest (jaeger) -> store (cassandra) -> query (jaeger)
Observability vendors that were founded during this time (eg. splunk, new relic, datadog) were likely built on a similar foundation (of distinct and separate services for each pillar).
NOTE: While the specifics of the implementation that vendors use are not public knowledge, their pricing model, both the dollar value as well as the dimensions that they charge for (eg. the amount of data indexed) suggest they use this architecture
Unified Collection
As observability grew in scope (and vendors in abundance), standards started emerging. This culminated with Open Telemetry (OTEL) being released in 2019 from the merger of the two big projects in this space: OpenTracing and OpenCensus.
In 2023, this standard has (mostly) come into maturity - they provide a vendor-neutral spec and implementation to collect metrics, logs, and traces from any source and send them to any destination.
All observability vendors today have support for OTEL.
Unified Storage
As observability data grew more voluminous, folks started to realize that the approach of using high-performant databases to store and index all this data did not scale.
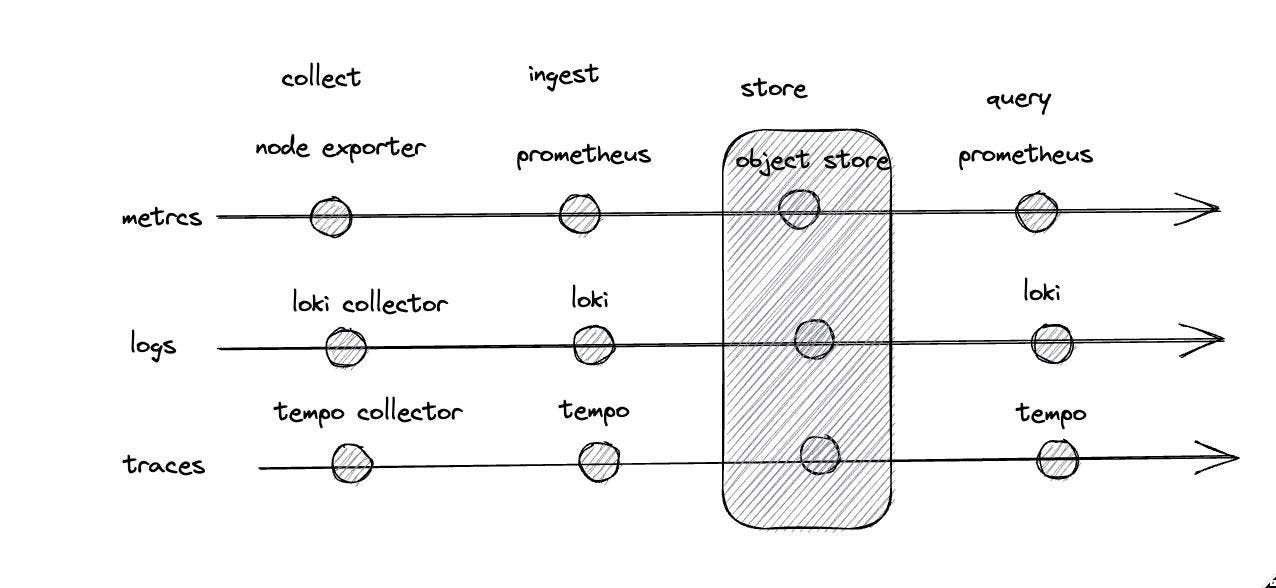
Instead of indexing everything upfront in an expensive database, you can get order-of-magnitude improvements in cost per byte by only doing a partial index and storing the data in cloud object storage solutions like S3 (usually with gzip + parquet).
In the open-source world, you can find this architecture in the following solutions:
Observability vendors that use an object storage backend: logz, grafana cloud, and axiom.
NOTE: Clickhouse is a high-performance open-source columnar database that is also a popular solution for storing metrics, logs, and traces. One downside with clickhouse is that it couples the storage layer with the query layer which means that fundamental decoupling of the two (which we'll cover later in this article) is infeasible in clickhouse-based architectures.
Unified Ingestion
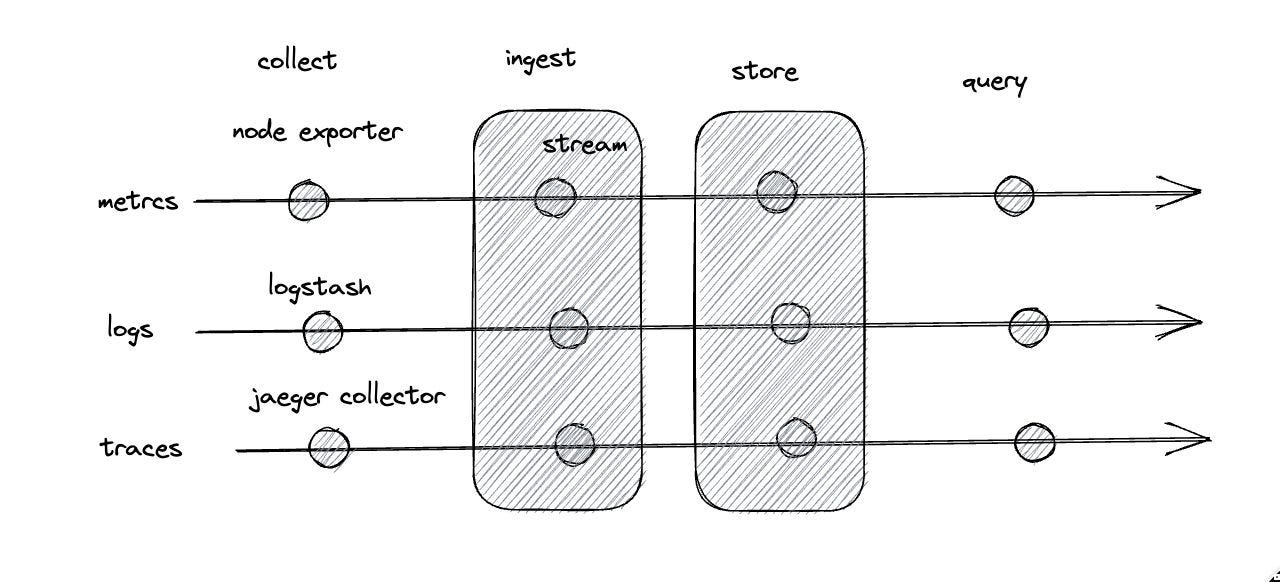
When all observability data is stored with unified storage, it becomes possible to also radically simplify its ingestion.
Ingestion is difficult at scale because of data volumes, throughput, and sudden changes in traffic patterns. Instead of standing up separate services to ingest data coming in for each pillar, you can consolidate everything using a streaming platform like Kafka. These platforms are designed to ingest data in real-time at scale and also allow real time enrichment and transformation of the data as it comes in.
I don't know of any open-source observability projects that use this architecture. Presumably, this is because you only start accruing benefits once you unify all three pillars with a common storage backend - otherwise, it's more efficient to build out a dedicated ingestion mechanism than taking the overhead of standing up something like Kafka
The observability vendor Coralogix employs a unified streaming-based architecture that does something similar.
Unified Querying
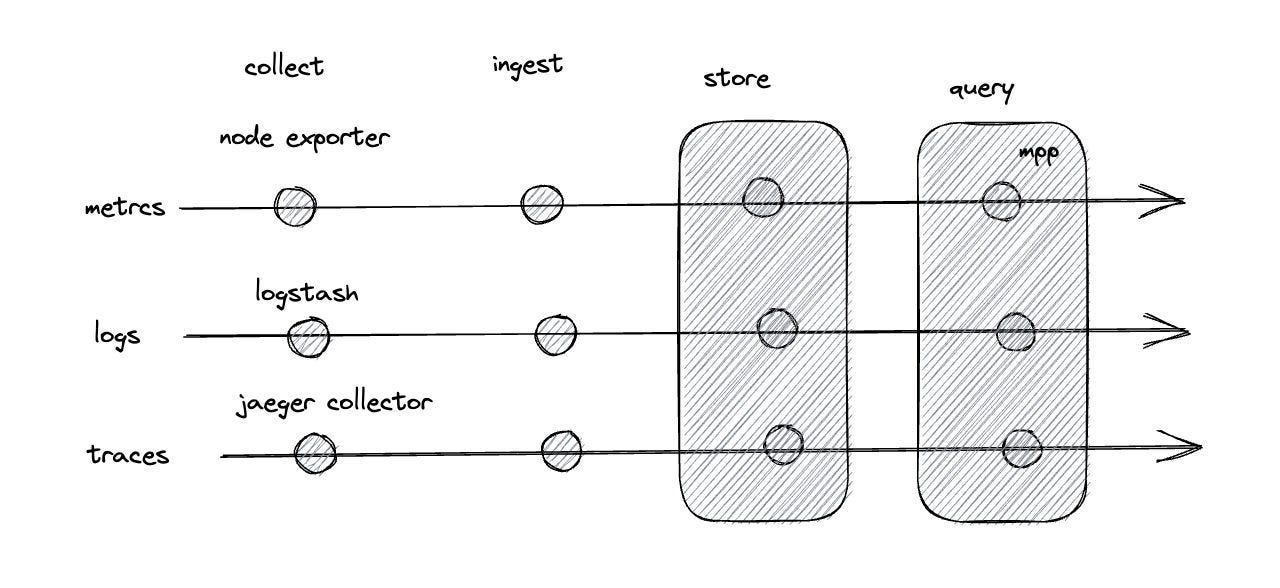
When all observability data is stored with unified storage, it becomes possible (and often necessary) to simplify the querying.
Querying terabytes of data is expensive when the data is indexed and hard to do at an acceptable latency when it is not. This is where massively parallel processing (MPP) techniques come into play - by spinning up many processors to independently process data (using tools like spark and Trino) and coupled with a metadata store like a hive or Apache Iceberg, it becomes possible to process terabytes of "un-indexed" data in seconds.
Like with ingestion, I don't know of any open-source observability platforms that use this architecture. The reason for this is similar to that of ingestion - unless you build out an observability platform that is made from day one to support all the pillars with unified storage, it's not worth the overhead of standing up something like Spark or Trino.
The observability vendor Observe employs a unified query architecture using Snowflake as its MPP engine.
Final Thoughts
There's a lot of observability data in the world and many platforms that enable you to make use of it. This is all at a price - the major driver of that price is the underlying architecture of the observability platform (and the margins that vendors want to make).
The unification of the storage layer enabled the ability to scale observability platforms while reducing costs by an order of magnitude. The unification of the ingestion layer and the querying layer has the potential to bring about similar benefits.
There's an opportunity today to create a massively more scalable and affordable observability platform by unifying every layer of the observability pipeline. In a prior post, we show how doing this for logs can bring down cost by over 95% when compared to datadog.
This sort of unified architecture effectively commodifies observability at scale. This is a good thing as the amount of data that is observed continues to grow - at the rate we're going, even enterprise companies are starting to look for alternative solutions due to costs.
All this said, being able to have the data on hand is just table stakes - the real value is being able to translate that information into insights and business outcomes. The sooner we can stop worrying about cost, the sooner we can get back to doing just that.


Nice overview of modern observability systems! I'd mention also VictoriaMetrics, which is frequently used as a building block for large-scale monitoring systems, since it needs less CPU, RAM and storage space than competing solutions. It is also much easier to setup and operate.
There is also VictoriaLogs - user-friendly open source database for logs. Comparing to Elasticsearch, it needs 30x less RAM and 15x less disk space.
Nice overview, Kevin. Very informative.