Logging with OpenTelemetry and Loki
A step-by-step guide to using OpenTelemetry's Logging SDK with Grafana Loki and NodeJS
Abstract of Loki warmings himself with logs, digital art
OpenTelemetry (OTEL) is the industry standard for managing telemetry data. The working group's main focus for the past three years is supporting the three pillars of observability: logs, metrics, and traces.
Today, there is a growing number of organizations that use OTEL for traces and metrics. It is not so for logging. In large part, this is because the logging API was not marked stable until April this year. Most people I talk to are still under the impression that OTEL does not support logs.
Today's post will attempt to correct the misconception. We will be using the NodeJS OTEL SDK to add logging to a simple web app. Logs will be collected using the otel agent (otel-collector-contrib) and exported to Loki, an open-source logging backend. Traces will be generated via auto-instrumentation and auto-correlated with logs (and vice versa). Semantic conventions will be mentioned.
For those who want to jump directly to the code, you can download the result on Github.
Setup the App
First, initialize your nodejs project and install express (a minimalist web framework for nodejs).
mkdir otel-node-demo
cd otel-node-demo
npm init -y
npm i express
Next, write the application code. This application exposes a single endpoint, /rolldice , which will return a random number between 1 and 6.
app.js
const express = require('express');
const PORT = parseInt(process.env.PORT || '8080');
const app = express();

app.get('/rolldice', (req, res) => {
  const randNum = getRandomNumber(1, 6)
  res.send((randNum).toString() + "\n");
});

app.listen(PORT, () => {
  console.log(`Listening for requests on http://localhost:${PORT}`);
});
Start the application. This will run an express server listening on port 8080
$ node app.js
Listening for requests on http://localhost:8080
In a separate terminal, you can roll the dice by sending a few requests to the /rolldice endpoint
$ curl localhost:8080/rolldice
5
$ curl localhost:8080/rolldice
3
Add Logs
To add logs, start by installing the necessary OTEL dependencies
npm i @opentelemetry/sdk-node \
  @opentelemetry/api \
  @opentelemetry/sdk-logs
NOTE: The status of the Javascript Logging SDK is currently in development
Next, create an initialization file for the OTEL NodeSDK
instrumentation.js
const { NodeSDK } = require('@opentelemetry/sdk-node');
const {
  SimpleLogRecordProcessor,
  ConsoleLogRecordExporter,
} = require('@opentelemetry/sdk-logs');

const sdk = new NodeSDK({
  logRecordProcessor: new SimpleLogRecordProcessor(
    // writes logs to stdout
    new ConsoleLogRecordExporter()
),
});
sdk.start();
Our current configuration will write logs to STDOUT. To write logs from our application, we need to acquire a logger instance and emit a log.
app.js
diff --git a/app.js b/app.js
index 8ee1efe..b916e9a 100644
--- a/app.js
+++ b/app.js
@@ -1,6 +1,8 @@
+const { logs, SeverityNumber } = require('@opentelemetry/api-logs');
+const logger = logs.getLogger('app', '0.1.0');

 app.get('/rolldice', (req, res) => {
   const randNum = getRandomNumber(1, 6)
+  const attributes = {
+    'roll': randNum
+  }
+  logger.emit({
+    severityNumber: SeverityNumber.INFO,
+    body: "exiting /rolldice",
+    attributes
+  });
   res.send(randNum.toString() + "\n");
 });
We can now restart our application with the instrumentation code preloaded.
# cancel the running server
$ CTRL-C

# restart the server while preloading our custom instrumentation
$ node -r ./instrumentation.js app.js
NOTE: The reason we wrote the SDK initialization code in a separate file is to set up instrumentation before loading the main script. This is not required for logging but it is for auto-instrumenting tracing (something we'll cover later in this post).
Sending a request should now yield JSON from the server
$ curl localhost:8080/rolldice
Output from the server shell
{
  timestamp: 1694367487002000,
  traceId: undefined,
  spanId: undefined,
  traceFlags: undefined,
  severityText: undefined,
  severityNumber: 9,
  body: 'exiting /rolldice',
  attributes: { roll: 1 }
}
NOTE: There are lots of fields like
traceIdandspanIdthat are currentlyundefined- these will be automatically filled when we add tracing.
Initialize the Collector
To send telemetry data, we need an endpoint that can ingest the OpenTelemetry Protocol (OLTP). For this guide, we will be using otel-collector-contrib
Download the collector
You can find the latest releases of the collector for all architectures here. In my case, since I'm running on an M1 Macbook, I will be using the otelcol-contrib_0.84.0_darwin_arm64.tar.gz
After downloading, unpack and verify that the collector is working.
$ cd ~/Downloads
$ tar -xzvf otelcol-contrib_0.84.0_darwin_arm64.tar.gz
$ ./otelcol-contrib -v

otelcol-contrib version 0.84.0
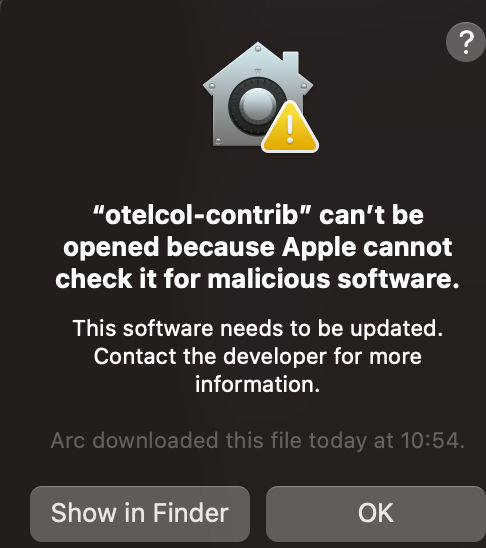
NOTE: If you are running on a Mac, you might get the following warning. > The latest Mac OS checks will warn you whenever you try to execute software that has not explicitly gone through Apple's review process (most open-source software falls into this camp). You can bypass this warning by following the instructions here
Create a collector config
The OTEL configuration tells the collector how to manage logs. In our case, we want to receive logs via OLTP and export it to Loki using the lokiexporter
otel.yaml
receivers:
  otlp/app:
    protocols:
      grpc:
      http:
exporters:
  loki:
    endpoint: "${env:LOGS_ENDPOINT}"
    auth:
      authenticator: basicauth/logs
extensions:
  basicauth/logs:
    client_auth:
      username: "${env:LOGS_USERNAME}"
      password: "${env:LOGS_PWD}"
service:
  extensions: [basicauth/logs]
  pipelines:
    logs/gc:
      receivers:
        - otlp/app
      exporters: [loki]
Note that we use the basicauth extension to authenticate access to our Loki instance. The OTEL collector can make use of environment variables inside the config using the ${env:KEY} syntax.
Get Loki configuration details
NOTE: The following is written with Grafana Cloud in mind and the Loki instance that comes with the free account. If you are self-hosting, the same configuration still applies but your authentication details will differ based on your setup.
You can find the config values for your endpoints by going to https://grafana.com/orgs/{YOUR_ORG} and clicking Details on the Loki data source. You might need to create an authentication token if one does not already exist. You can find further instructions for authenticating with grafana cloud here
Start the collector
For our demo app, we are going to use env files and dotenv to simplify passing configuration details to the collector.
First, install dotenv and create a .env file
npm i -g dotenv
# make sure to not commit your .env file
echo ".env" >> .gitignore
touch .env
Fill the .env file with the relevant configuration values
LOGS_ENDPOINT=
LOGS_USERNAME=
LOGS_PWD=
Start the collector in a separate terminal
# to simplify instructions, we move the collector to the same directory as our application
$ mv /path/to/otelcol-contrib .

$ npx dotenv -- ./otelcol-contrib --config otel.yaml

2023-09-10T11:15:48.834-0700    info    service/telemetry.go:84 Setting up own telemetry...
...
2023-09-10T11:15:48.835-0700    info    service/service.go:161  Everything is ready. Begin running and processing data.
At this point, you should have three terminals carrying out the following functions:
running your application
running the collector
making curl requests to the application
Update the App to Export Logs
We now need to update our app to send logs to the OLTP endpoint (instead of STDOUT).
First, add the required OTEL package to export logs
npm i @opentelemetry/exporter-logs-otlp-proto
Next, update the SDK initialization logic to use the OLTPLogsExporter
instrumentation.js
diff --git a/instrumentation.js b/instrumentation.js
index 3f76659..663129d 100644
--- a/instrumentation.js
+++ b/instrumentation.js
@@ -2,10 +2,12 @@
 const { NodeSDK } = require('@opentelemetry/sdk-node');
 const {
   SimpleLogRecordProcessor,
-  ConsoleLogRecordExporter,
 } = require('@opentelemetry/sdk-logs');
+const {
+  OTLPLogsExporter
+} = require('@opentelemetry/exporter-logs-otlp-proto');

 const sdk = new NodeSDK({
-  logRecordProcessor: new SimpleLogRecordProcessor(new ConsoleLogRecordExporter()),
+  logRecordProcessor: new SimpleLogRecordProcessor(new OTLPLogsExporter()),
 });
 sdk.start();
Finally, restart the app
# cancel the running server
$ CTRL-C

# restart
$ node -r ./instrumentation.js app.js
Now send some requests to the app endpoint. You'll notice that logs no longer show up in the console.
Query for Logs
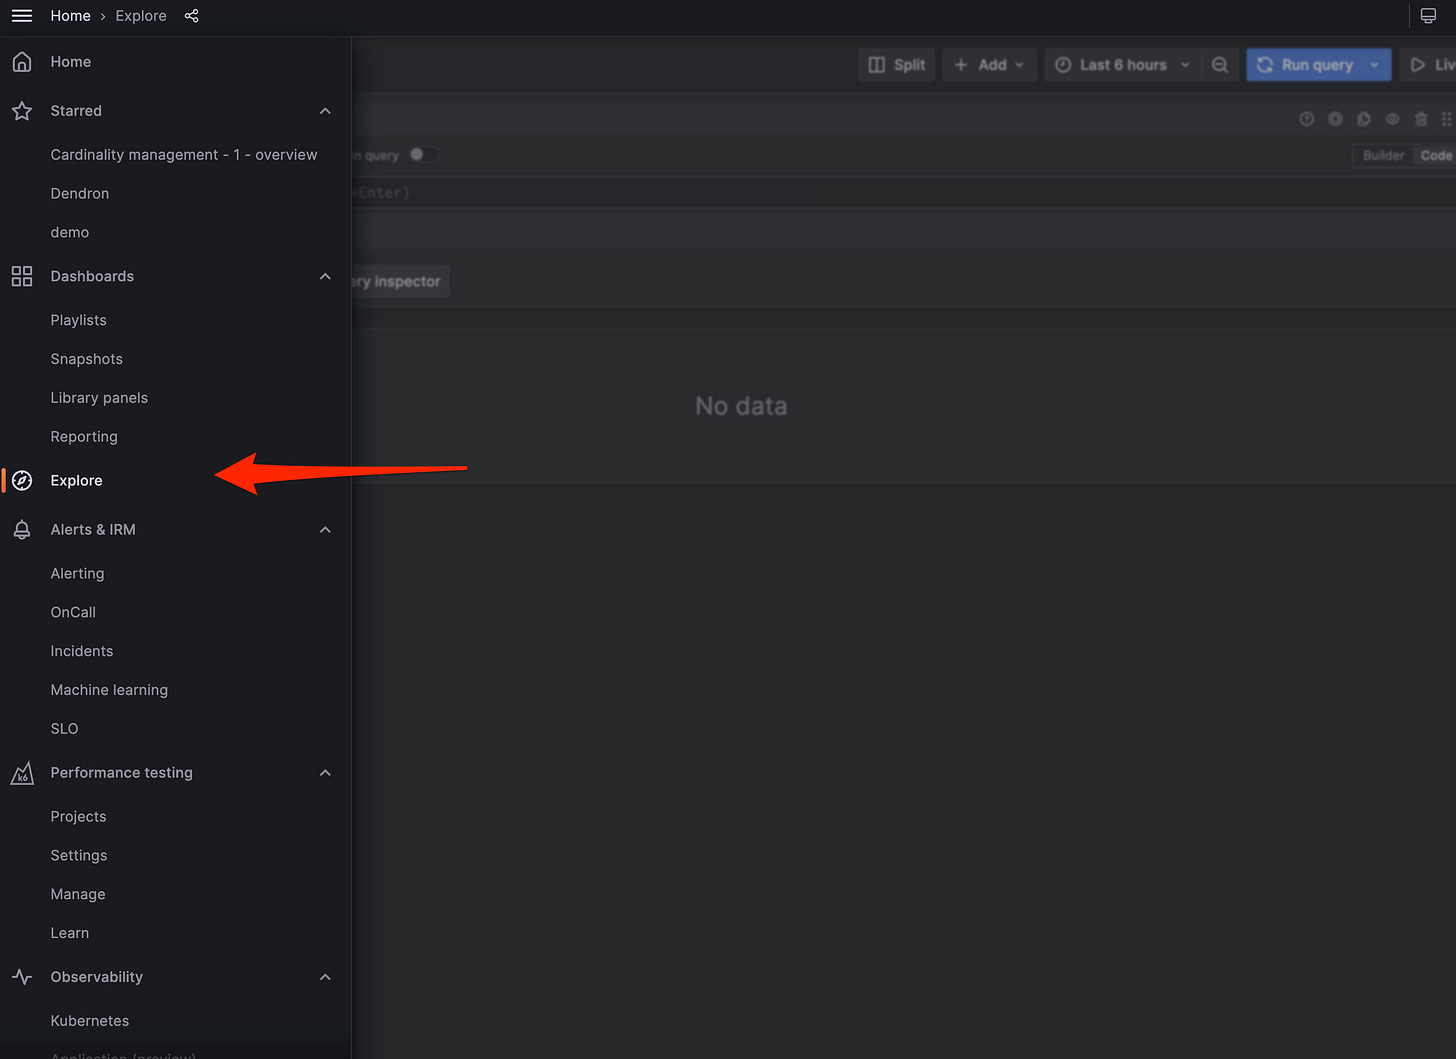
If everything is instrumented correctly, logs should now be appearing in Loki. To find them, login to Grafana and go to the Explore panel of the Grafana console
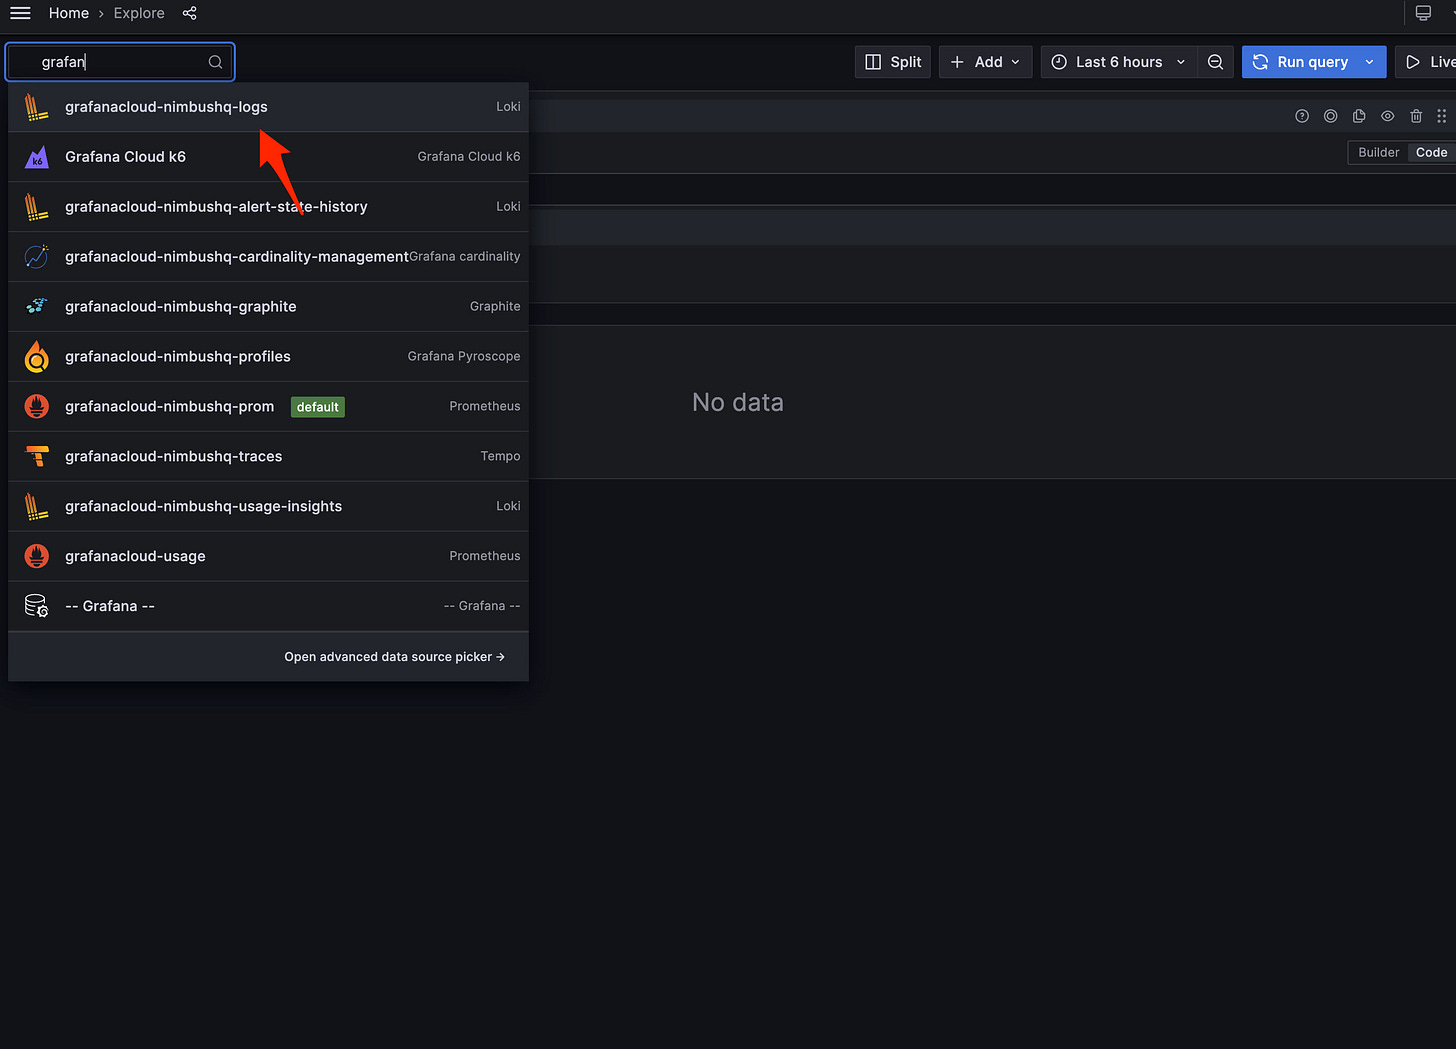
Choose the Loki data source
Run the following query
{exporter="OTLP"}
NOTE: The search syntax we used is LogQL. It is similar to PromQL (for good and bad...) and lets you search logs in Loki.
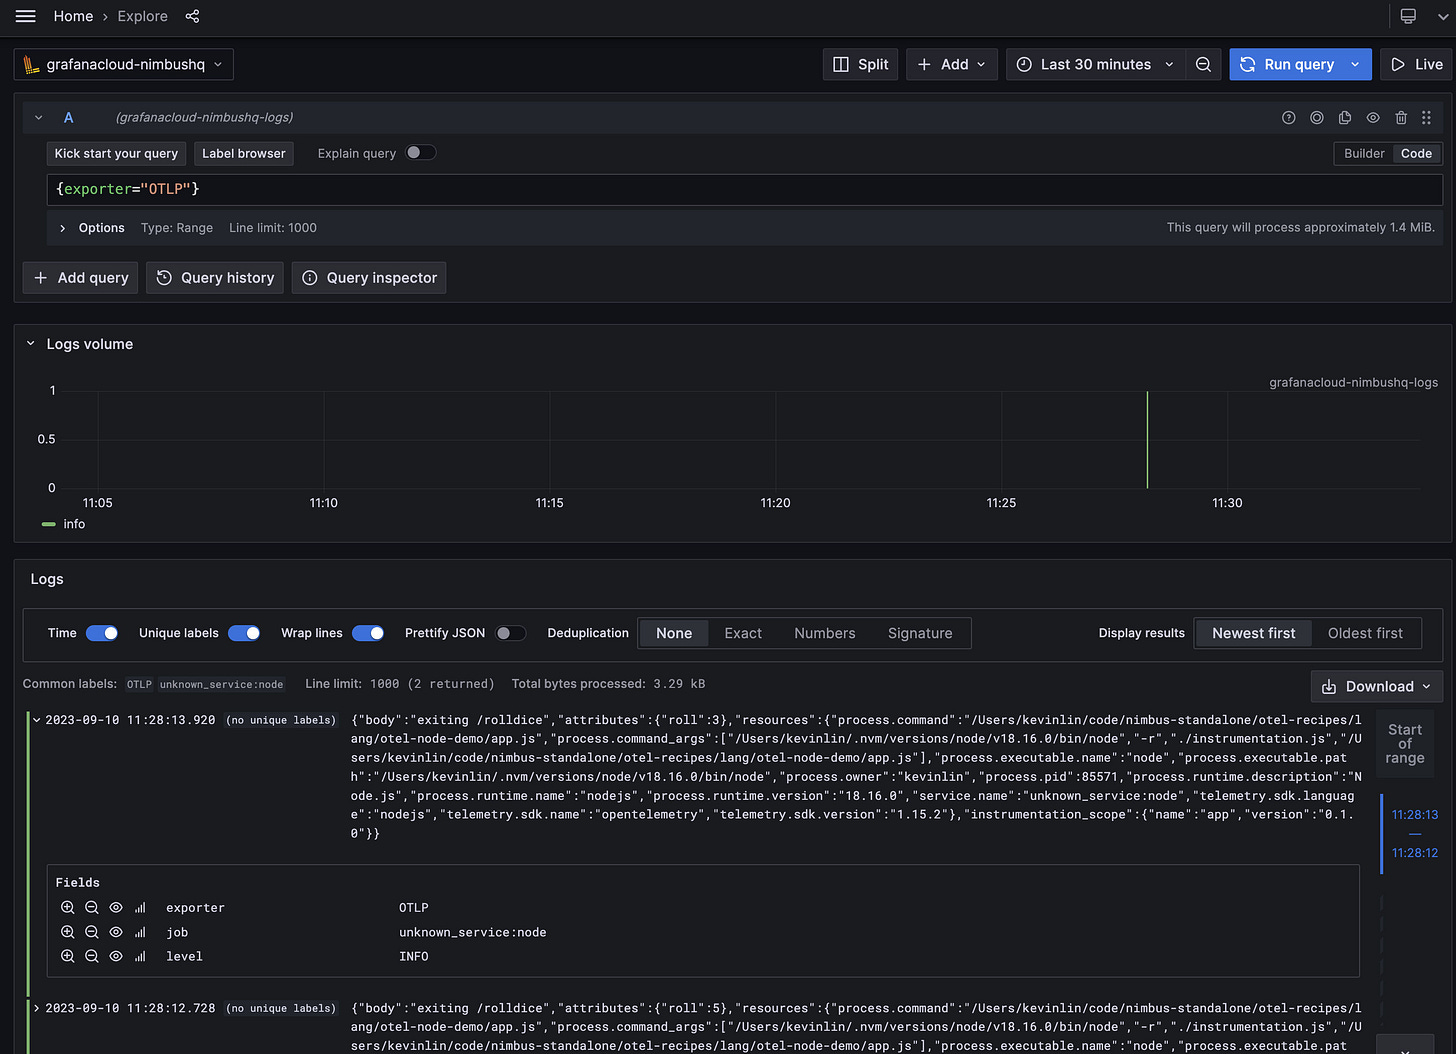
You should get the following output
The lokiexporter automatically attaches three labels by default to all outgoing logs: exporter (always set to OTLP), job (set to service.name), and level (log level).
NOTE: Loki differs from traditional solutions like
elasticsearchin that it only indexes labels instead of the entire log line.
Our initial query tells Loki to fetch all logs that have the exporter=OLTP label. By default, the lokiexporter does not turn any other fields into labels.
Add Labels
If you inspect the JSON payload, you'll notice that the log message has attributes and resources
{
  "body": "exiting /rolldice",
  "attributes": {
    "roll": 3
  },
  "resources": {
    ...
    "service.name": "unknown_service:node",
    "telemetry.sdk.language": "nodejs",
  },
  ...
}
In OTEL, a resource is metadata about the entity producing telemetry (eg. the service name). An attribute is all other metadata (eg. the roll).
The lokiexporter looks for the special attribute key loki.attribute.labels to determine whether additional attributes should be converted to labels. The resource attribute key loki.resource.labels serves the same purpose for resources.
You can add additional metadata to the log payload to tell Loki to treat certain fields as labels. While we could do this in code, it's much more efficient to do this as a processor in the collector. This allows us to automatically add the metadata to all log telemetry without changing the code.
To add custom attributes in the collector, use the attribute processor. Use the resource processor to do the same for resource metadata. We will now use these processors to add roll and service.name as Loki labels.
diff --git a/otel.yaml b/otel.yaml
index badf962..e74378c 100644
--- a/otel.yaml
+++ b/otel.yaml
@@ -3,6 +3,17 @@ receivers:
     protocols:
       grpc:
       http:
+processors:
+  resource/loki:
+    attributes:
+      - action: insert
+        key: loki.resource.labels
+        value: service.name
+  attributes/loki:
+    actions:
+      - action: insert
+        key: loki.attribute.labels
+        value: roll
@@ -19,4 +30,5 @@ service:
  pipelines:
     logs/gc:
       receivers:
         - otlp/app
+      processors: [resource/loki, attributes/loki]
       exporters: [loki]
Now restart the collector. Like restarting the server, this involves sending a terminating signal to the collector and restarting
# in the terminal where the collector is running
CTRL-C

# restart the collector
$ npx dotenv -- ./otelcol-contrib --config otel.yaml
NOTE: Since all the changes are on the collector side, we do not need to restart the application or change the application code for the changes to take effect.
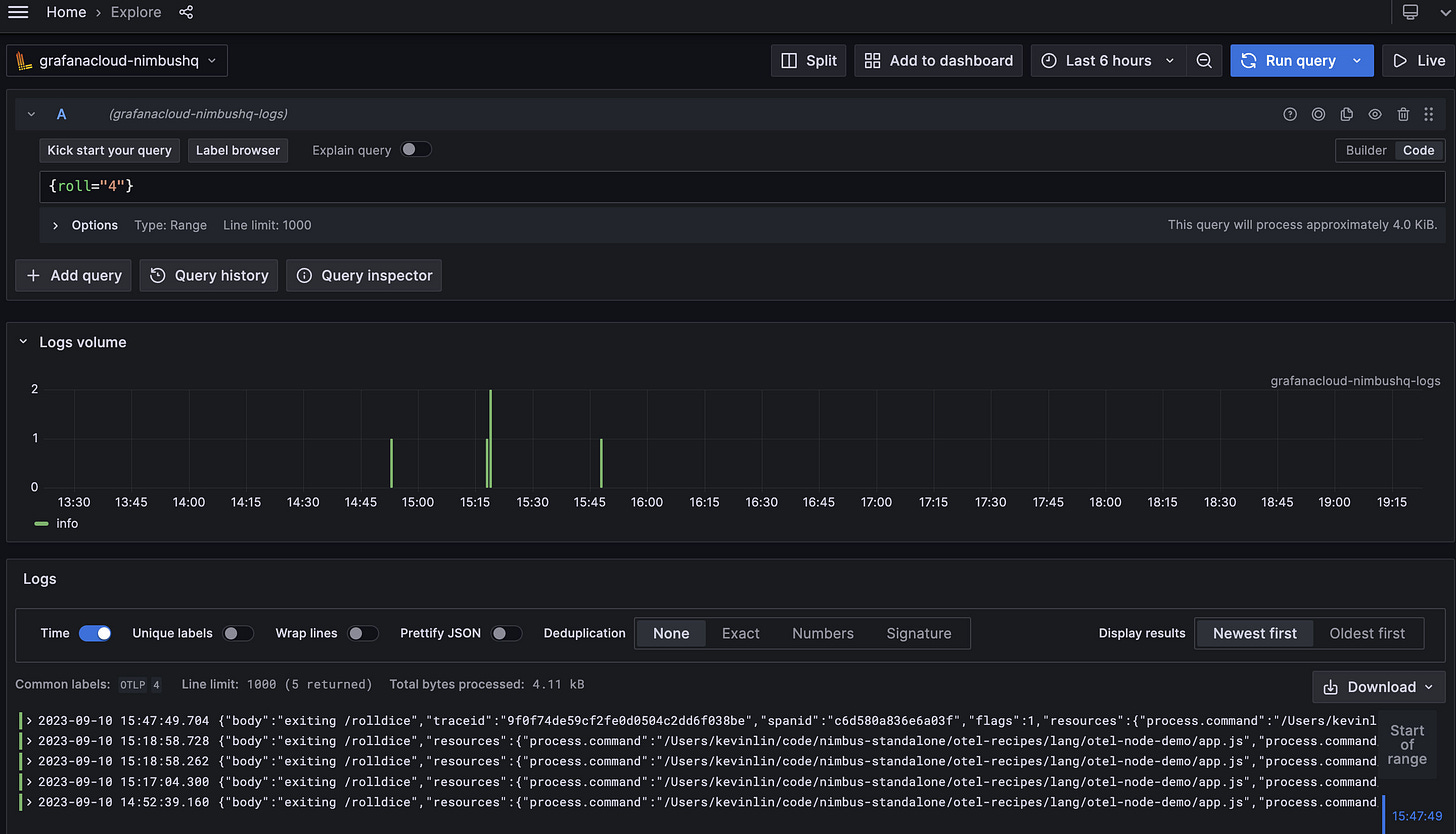
Now send a few more requests to the application. Query for logs in Loki again and you should see the following result:
roll and service.name are now both labels.
NOTE: Loki does not allow for
.in the label name - thelokiexporterautomatically translates.into_
You can now directly query the new labels. For example, querying by roll value
{roll="4"}
Use Semantic Conventions
If you look closely at the JSON log payload, you might have noticed that the service name is currently not helpful: unknown_service:node. This is because we have not yet set the name in our application.
The service name can be set when the SDK is initialized. It serves as the primary identifier of the service being instrumented. The service name key and its description are specified by the OTEL Semantic Convetions. These are a set of common values used to describe metadata associated with telemetry.
You can access semantic convention keys by using the language-specific helper packages.
npm i @opentelemetry/semantic-conventions @opentelemetry/resources
instrumentation.js
diff --git a/instrumentation.js b/instrumentation.js
index 663129d..4e2d651 100644
--- a/instrumentation.js
+++ b/instrumentation.js
@@ -6,8 +6,19 @@ const {
 const {
   OTLPLogsExporter
 } = require('@opentelemetry/exporter-logs-otlp-proto');
+const { Resource } = require('@opentelemetry/resources');
+const {
+  SemanticResourceAttributes,
+} = require('@opentelemetry/semantic-conventions');

+const resource = Resource.default().merge(
+  new Resource({
+    [SemanticResourceAttributes.SERVICE_NAME]: "otel-node-demo",
+    [SemanticResourceAttributes.SERVICE_VERSION]: "0.1.0",
+  }),
+);
 const sdk = new NodeSDK({
+  resource,
   logRecordProcessor: new SimpleLogRecordProcessor(new OTLPLogsExporter()),
 });
 sdk.start();
Since we want to index the service version, we are also going to update our collector configuration to convert it to a Loki label.
otel.yaml
diff --git a/otel.yaml b/otel.yaml
index badf962..e74378c 100644
--- a/otel.yaml
+++ b/otel.yaml
processors:
  resource/loki:
    attributes:
      - action: insert
        key: loki.resource.labels
-        value: service.name
+        value: service.name, service.version
Because we've changed both the collector and the instrumentation code, we need to restart both components for the changes to take effect.
After restarting and sending a few requests, query again in Loki to see both the service name and version show up in the results
Add Auto Instrumentation
By adding OTEL traces to our application, we get trace information in our logs for free.
First, install the auto instrumentation package. This will automatically inject traces into your application at run time.
npm i @opentelemetry/auto-instrumentations-node
Next, initialize the OTEL SDK with the auto instrumentations.
instrumentation.js
diff --git a/instrumentation.js b/instrumentation.js
index 4e2d651..6a0f794 100644
--- a/instrumentation.js
+++ b/instrumentation.js
@@ -10,15 +10,19 @@ const { Resource } = require('@opentelemetry/resources');
 const {
   SemanticResourceAttributes,
 } = require('@opentelemetry/semantic-conventions');
+const {
+  getNodeAutoInstrumentations,
+} = require('@opentelemetry/auto-instrumentations-node');

 const resource = Resource.default().merge(
   new Resource({
     [SemanticResourceAttributes.SERVICE_NAME]: "otel-node-demo",
-    [SemanticResourceAttributes.SERVICE_VERSION]: "0.1.0",
+    [SemanticResourceAttributes.SERVICE_VERSION]: "0.1.1",
   }),
 );
 const sdk = new NodeSDK({
   resource,
   logRecordProcessor: new SimpleLogRecordProcessor(new OTLPLogsExporter()),
+  instrumentations: [getNodeAutoInstrumentations()],
 });
 sdk.start();
Now, restart the application, make a few requests, and run a new query in Loki.
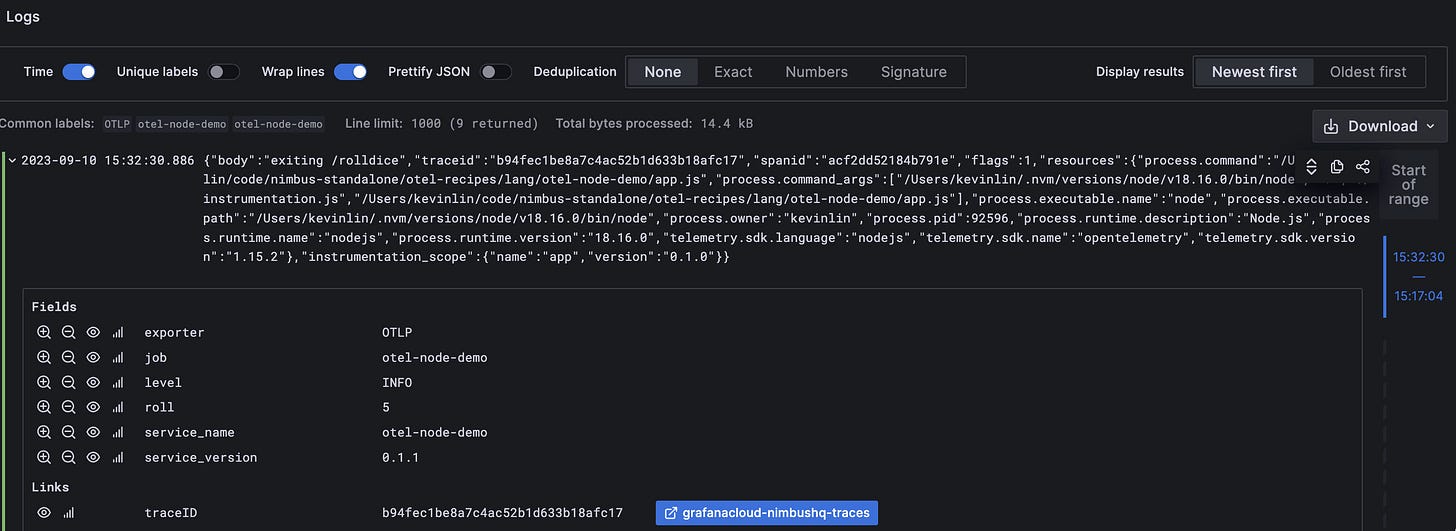
You should see the following fields in the log payload. These values were added automatically by the trace.
{
  "body": "exiting /rolldice",
  "traceid": "b94fec1be8a7c4ac52b1d633b18afc17",
  "spanid": "acf2dd52184b791e",
  ...
}
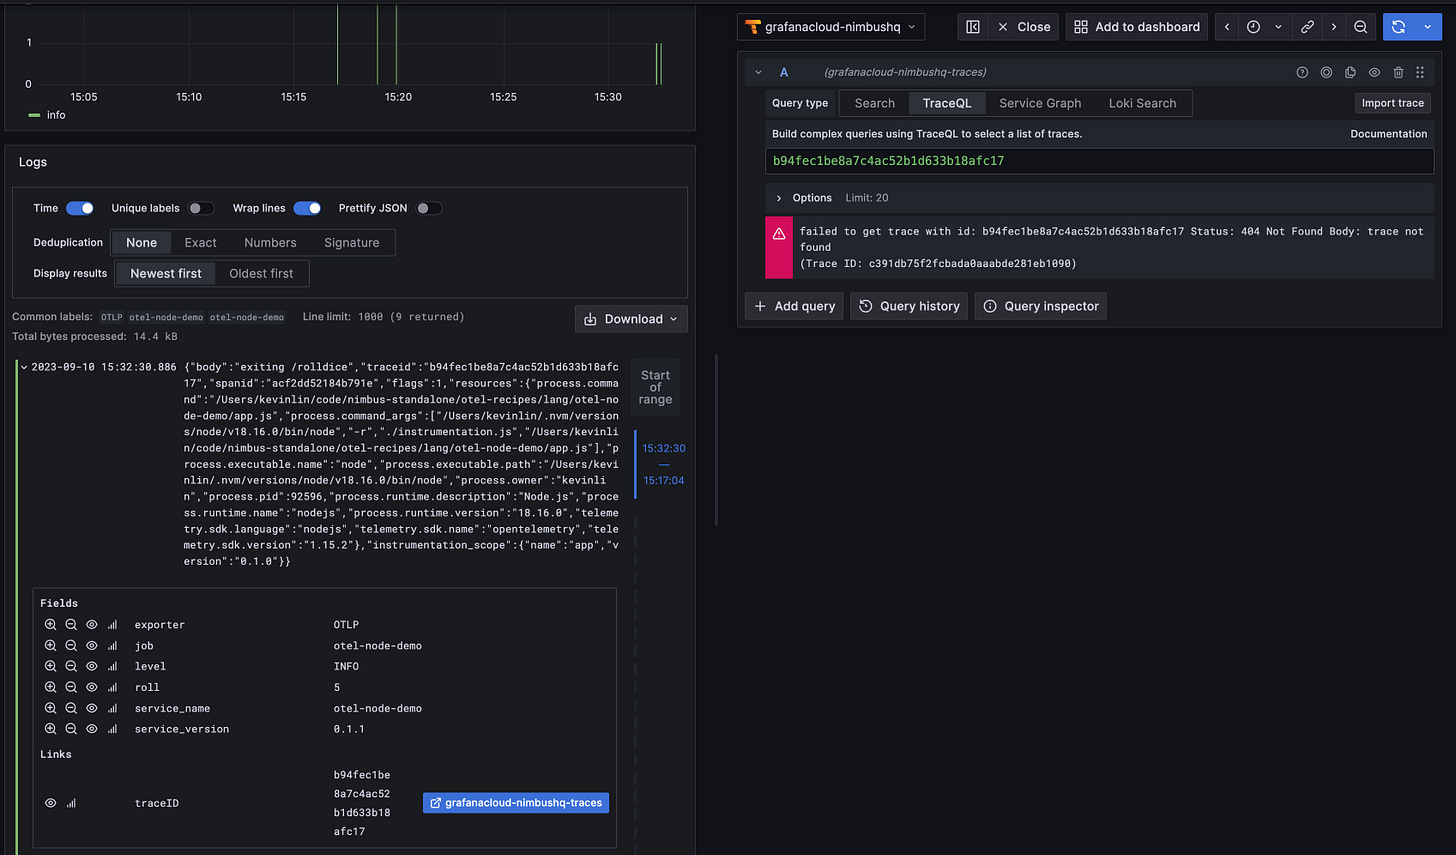
Even though we're not using traces in our app, having the traceid and spanid as part of the log metadata makes the logs more useful as you can query those ids to get what are essentially trace events.
If we took the extra step of actually exporting traces, we would be able to jump directly to the trace from the log (aka the big blue button from the diagram below). Unfortunately, we won't get any results right now since we haven't done that.
Export Traces
Let's export traces to see what results would look like. First, install the tracing exporter package.
npm i @opentelemetry/exporter-trace-otlp-proto
Next, update the OTEL configuration to send traces to Tempo. Tempo is an open-source distributed tracing backend that is also available in Grafana Cloud. Don't forget to also update your configuration in .env to pass in the TRACE_* configuration.
otel.yaml
diff --git a/otel.yaml b/otel.yaml
index 167a6b2..5ac7201 100644
--- a/otel.yaml
+++ b/otel.yaml
  exporters:
+  otlp/traces:
+    endpoint: ${env:TRACES_ENDPOINT}
+    tls:
+      insecure: false
+    auth:
+      authenticator: basicauth/traces
 extensions:
+  basicauth/traces:
+    client_auth:
+      username: "${env:TRACES_USERNAME}"
+      password: "${env:TRACES_PWD}"
 service:
   extensions: [basicauth/logs]
   pipelines:
+    traces/gc:
+      receivers:
+        - otlp/app
+      exporters: [otlp/traces]
NOTE: Tempo has built-in OTLP support and thus works with the builtin OLTP exporter
Finally, update the app to export traces
app.js
diff --git a/instrumentation.js b/instrumentation.js
index 6a0f794..2265a4d 100644
--- a/instrumentation.js
+++ b/instrumentation.js
@@ -13,16 +13,20 @@ const {
const {
 getNodeAutoInstrumentations,
} = require('@opentelemetry/auto-instrumentations-node');
+const {
+  OTLPTraceExporter,
+} = require('@opentelemetry/exporter-trace-otlp-proto');

const resource = Resource.default().merge(
 new Resource({
   [SemanticResourceAttributes.SERVICE_NAME]: "otel-node-demo",
-    [SemanticResourceAttributes.SERVICE_VERSION]: "0.1.1",
+    [SemanticResourceAttributes.SERVICE_VERSION]: "0.1.2",
 }),
);
const sdk = new NodeSDK({
 resource,
 logRecordProcessor: new SimpleLogRecordProcessor(new OTLPLogsExporter()),
+  traceExporter: new OTLPTraceExporter(),
 instrumentations: [getNodeAutoInstrumentations()],
});
sdk.start();
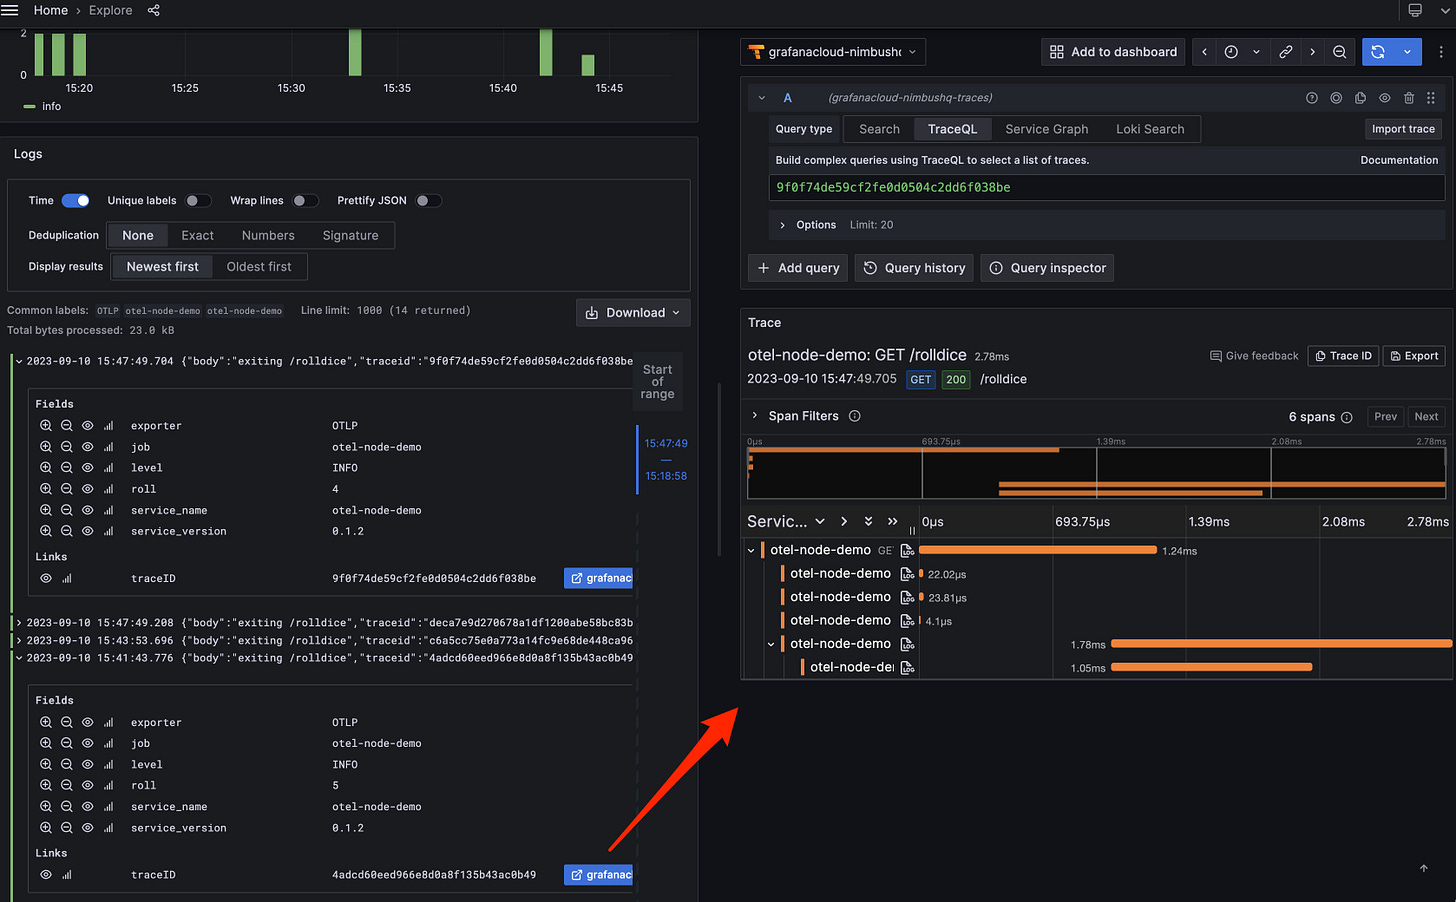
With the changes in place, restart both the collector and the app. Send a request and query for logs in Loki. When the log results show up, you should now be able to jump from log to the corresponding trace.
Note that this also works in reverse.
Final Thoughts
It took three years from the inception of OTEL for the logs API to finally hit GA. While SDK maturity currently varies by language, it is now more usable and can bring big benefits.
In some sense, logging maturity in OTEL has a greater impact on observability than traces. As useful as traces are, most organizations still don't use them. All organizations use logs. By using logs via OTEL, you can even get many of the benefits of tracing (eg. automatic traceid and spanid) without having to store traces.
And for organizations that make use of all three pillars, OTEL breaks down the barriers between signals and enables autocorrelation between traces, logs, and metrics.
All this to say - logs are great. OTEL can make them better.






Good Tutorial. Easy to follow up. Thank you for writing this. It helped me learn more about Open Telemetry.